


Quick Data Exploration - Python
Finding the number of columns and rows, finding what columns are there, and data types - Using Python (pandas)


Hi There! Welcome to Data 101.
NOTE:
I'll be using Google's Colab and Python in the article.
To learn how to read files, refer to the previous article in this series :
Data Exploration
In Data Exploration, we look into finding the number of instances of records, number of columns and rows, the columns and data types in each column...
I will be using pandas library throughout.
I will be using airlines and airports CSV files.
To import the data:
import pandas as pd
airlines = pd.read_csv('airlines.csv')
airports = pd.read_csv('airports.csv')
Viewing First and Last few rows
To view the first 5 rows on the data set, we use .head() from pandas.
airports.head()
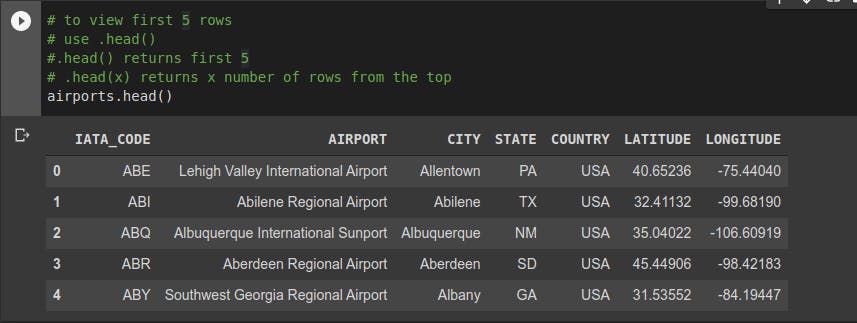
You can use .head(x) to get x number of rows from the top
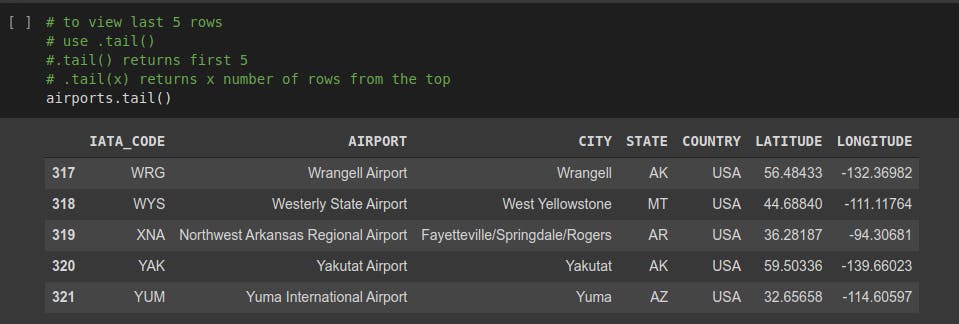
To view the last 5 rows on the data set, we use .tail() from pandas.
airports.tail()
Viewing Rows and Columns
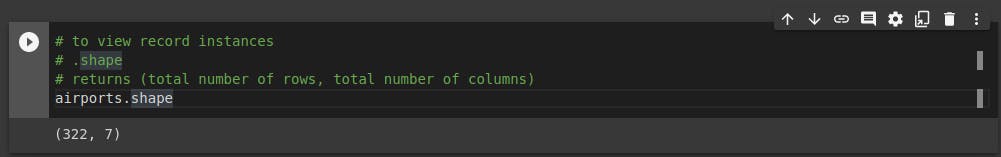
To know the number of columns and rows in your data frame, use .shape. It returns the dimensions of your data set:
airports.shape
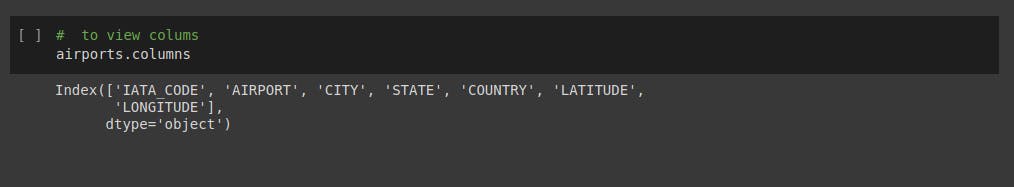
To view the columns in the data frame, use .columns()
airports.columns
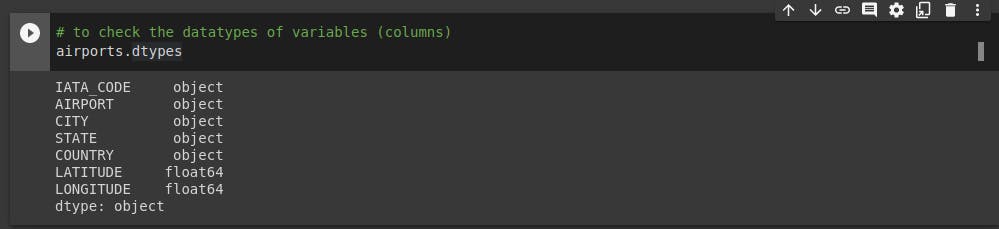
Viewing Data Types
To view datatypes of each data in each column, use .dtypes:
airports.dtypes
Other tricks you could use are:
x.rows
x.info()
x.describe()
x.unique()
x.describe()